UITS Funding Sources & Uses
Revenues
Carry Forward In
$9,470,941
| UITS Admin | Student & Acad Tech | Research & Discovery Tech | Admin Tech | UAIR | Information Security Office | Infrastr & Foundational Tech | Campus IT Partnerships + IT Support | UITS Total | |
|---|---|---|---|---|---|---|---|---|---|
| Institutional | $7,189,122 | $3,259,405 | $2,365,477 | $5,105,422 | $4,046,236 | $3,820,405 | $5,117,314 | $4,654,238 | $35,557,620 |
| Service Center | 1,420 | 105,502 | 46,807 | 143,998 | 4,661,483 | 1,254,181 | 6,213,390 | ||
| Strategic | 61,691 | 1,391,885 | 10,178 | 1,463,753 | |||||
| Student | 3,262,043 | 4,607,556 | 1,511,423 | 2,118,888 | 11,499,910 | ||||
| TRIF | 850,000 | 78,238 | 928,238 | ||||||
| Transfers In | 10,412,255 | 200,000 | 3,254,000 | 449,993 | 6,327,570 | 20,643,818 | |||
| Revenue Subtotal | $10,514,276 | $18,384,718 | $3,262,284 | $6,697,307 | $7,444,234 | $4,348,636 | $17,617,790 | $8,037,485 | $76,306,729 |
Expenditures
| UITS Admin | Student & Acad Tech | Research & Discovery Tech | Admin Tech | UAIR | Information Security Office | Infrastr & Foundational Tech | Campus IT Partnerships + IT Support | UITS Total | |
|---|---|---|---|---|---|---|---|---|---|
| Personnel IT | $5,140,642 | $627,176 | $2,303,610 | $2,757,100 | $1,426,784 | $5,851,755 | $3,322,090 | $21,426,158 | |
| Personnel Non-IT | 1,597,635 | 83,017 | 777,939 | 236,770 | 124,567 | 81,540 | 2,901,467 | ||
| ERE | 491,146 | 1,496,005 | 431,472 | 723,334 | 970,459 | 445,137 | 1,856,965 | 1,003,592 | 7,418,110 |
| Op Ex Software | 374,212 | 4,577,718 | 346,568 | 2,006,089 | 287,610 | 2,465,781 | 4,564,446 | 1,982,022 | 16,604,447 |
| Cap Ex IT | 44,127 | 231,080 | 275,207 | ||||||
| General Expenses | 690,312 | 9,437,821 | 766,374 | 1,460,707 | 202,794 | 336,560 | 5,187,764 | 376,871 | 18,459,292 |
| Capital | 15,082 | 699,668 | 3,509,348 | 664,924 | 4,889,023 | ||||
| Transfers Out | 1,071,288 | 234,551 | 1,305,839 | ||||||
| Strategic Reduction | 1,863,703 | 2,522,205 | 4,385,098 | ||||||
| Expense Subtotal | $4,239,675 | $23,298,574 | $6,503,004 | $6,493,741 | $6,976,938 | $4,671,352 | $18,716,051 | $6,766,116 | $77,665,450 |
| Revenue Minus Expense | $6,274,601 | ($4,913,856) | ($3,240,720) | $203,567 | $467,296 | ($322,716) | ($1,089,561) | $1,271,369 | ($1,358,721) |
Carry Forward Out
$8,112,220
Sources
UAccess Financials
Payroll Expenditure Listing (PEL) with SET
G-MF Income/Expense - Productions
All Funds Reconciliation Transfers
$7.8M
End of Life Equipment Deferred Maintenance Costs
The university has accumulated deferred network infrastructure maintenance due to the lack of increase in the FTE fee since 2008. The replacement cost of the network equipment currently deployed on campus is $29 Million, $7.8 million of which is end of life and needs to be refreshed.

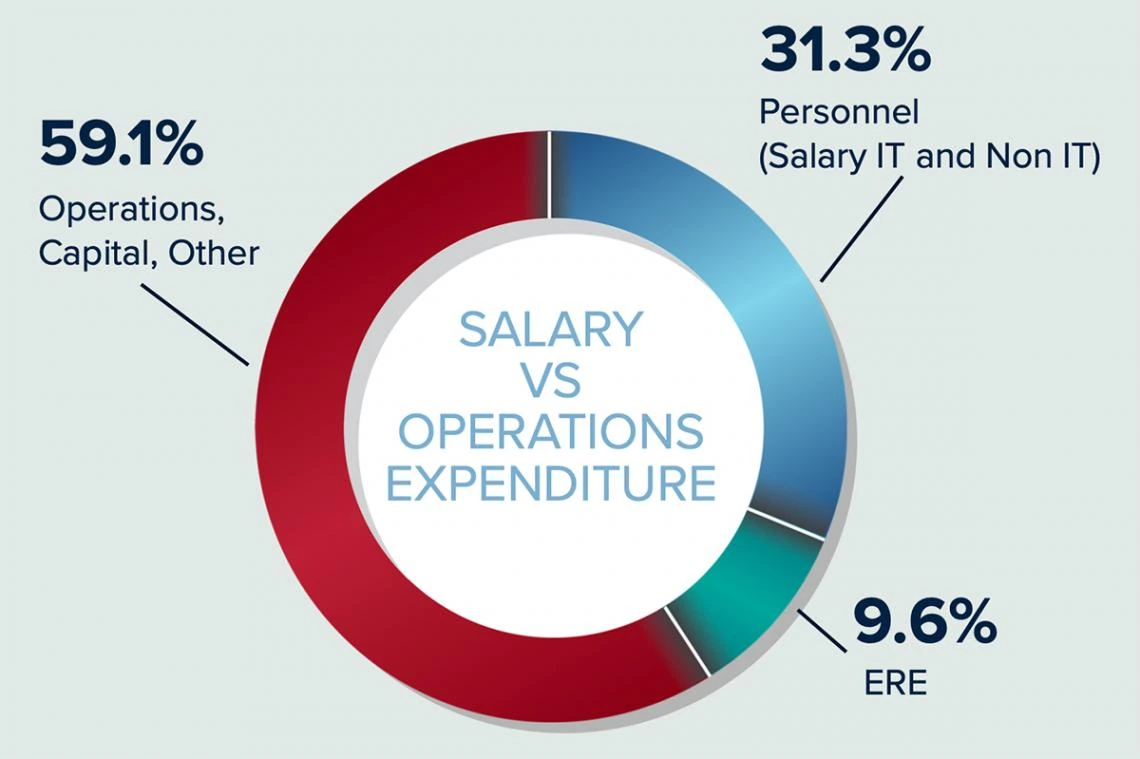
UITS is unlike the many other organizations at the University. Only 40% of UITS expenditures is used to support employee salary and wages.
