EMPOWERING DECISION MAKING THROUGH DATA ANALYTICS
University Analytics & Institutional Research provides data that empowers campus decision makers, informs policy and practice, and tells the University of Arizona story.
Helping Decision-Makers Interact with University Data
Campus users and senior leadership needing to see commonly requested data have a new and convenient way to access it—Arizona Profiles.
University Analytics & Institutional Research (UAIR) delivered this set of UAccess Analytics dashboards as one of the University of Arizona’s Strategic Plan initiatives. This effort is one of the largest products UAIR has launched and is part of the team’s ongoing efforts to increase data accessibility and literacy.
Arizona Profiles is easy to understand and access. Decision makers can see at a glance trends and figures in areas such as workforce, faculty, demographics, students, and financials. A key pillar of the project was user-friendly design, with the UAIR Design System informing readability and clean tables and graphs.
Highly relevant information is immediately available at the top level. Viewers can click on links to access additional in-depth panels and dashboards to view source information and more specific data.
With nine distinct dashboards and 350 data measures, a great deal of data is right at the fingertips for the campus community.
The Arizona Profiles cover a diverse range of information across key areas beneficial to most UAccess Analytics users. By default, the profile pages will populate based on the user’s college or department.
Additional information and resources are located on UAIR’s website, with introductory videos and guides into specific profiles as part of the Data Exploration Series.
The launch of Arizona Profiles has already been a success. With hundreds of users and queries numbering in the hundreds of thousands, it is clear that Arizona Profiles have filled an important need. UAIR will continue to enhance the dashboards to make data accessible to campus.
Dashboard Data Informs Pandemic Response
The COVID-19 pandemic shone a spotlight on the importance of data driven decision making for campus leadership. Because complex policies can impact tens of thousands of students and employees—accurate information is vital.
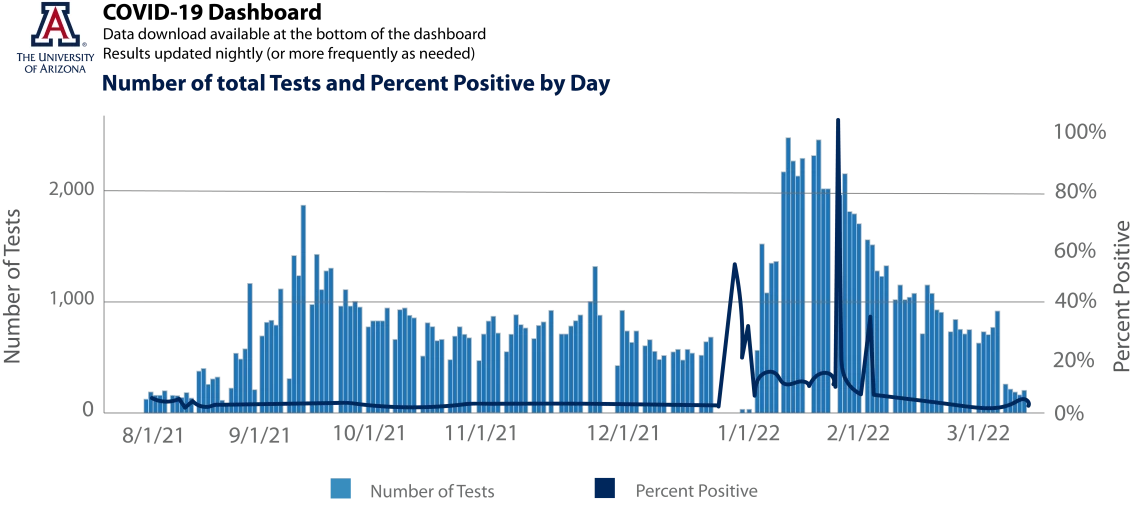
This made developing the COVID-19 dashboard a critical UAIR project in FY21. UAIR collaborated with numerous campus units on the project, and continues to adapt the dashboard when circumstances change, as when vaccination rates were added.
Top-level information includes positivity rates, test numbers, isolation bed availability, vaccine administration details, and breakdowns by race/ethnicity and age. Data is sourced from Campus Health, state, federal, and other institutional data sources.
The COVID-19 Dashboard has served as a reliable source of information for internal and external stakeholders and a key component in the University’s overall pandemic response strategy.

“Never before has our campus had access to a centrally defined set of institutional metrics like Arizona Profiles. This tool has truly revolutionized our ability to have conversations about strategic goals and outcomes from a common starting point.”
